Note
This page was generated from visualize_data_samples.ipynb.
Note
If running outside of the Docker image, you may need to set some environment variables manually. You can do it like so:
import os
from subprocess import check_output

os.environ['GDAL_DATA'] = check_output('pip show rasterio | grep Location | awk \'{print $NF"/rasterio/gdal_data/"}\'', shell=True).decode().strip()
We will be accessing files on S3 in this notebook. Since those files are public, we set the AWS_NO_SIGN_REQUEST to tell rasterio to skip the sign-in.
[ ]:
%env AWS_NO_SIGN_REQUEST=YES
Plot samples from Datasets using Visualizers#
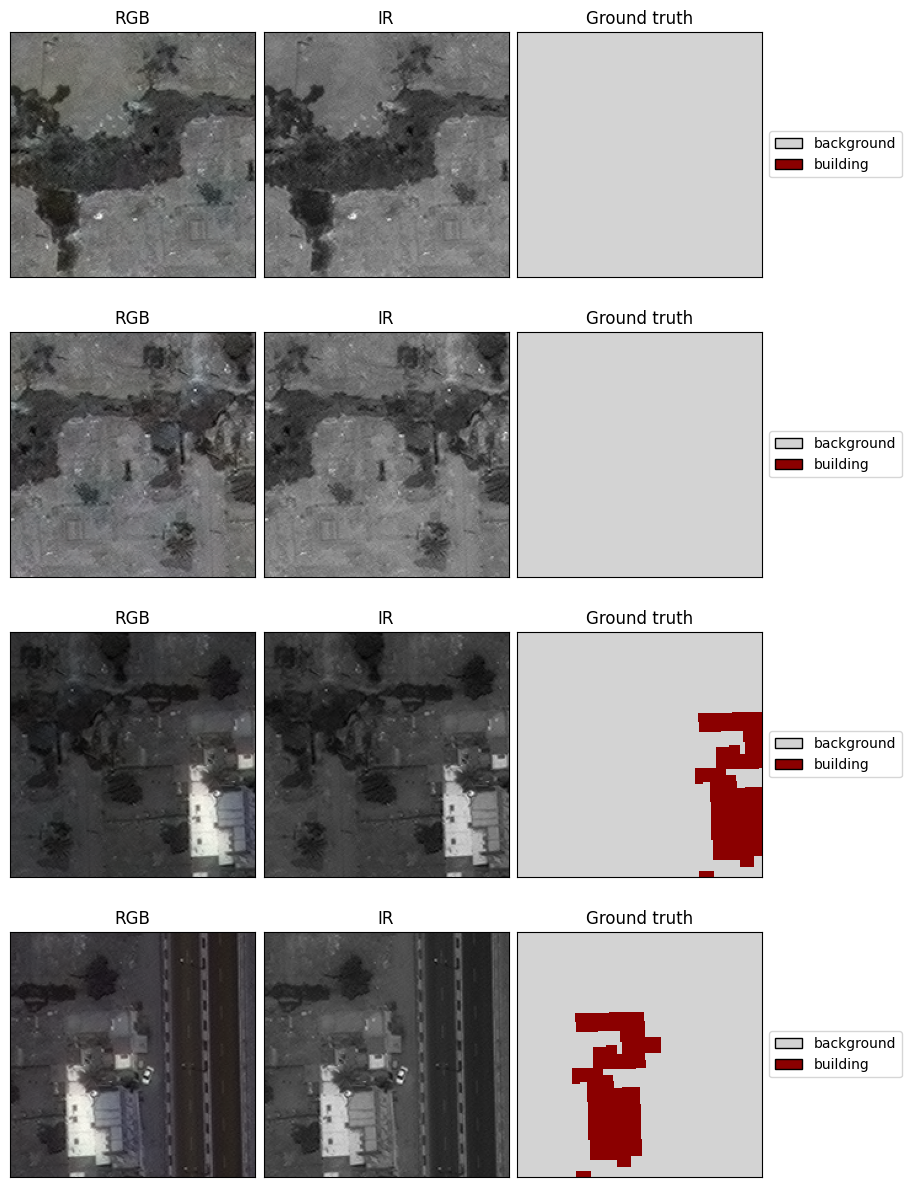
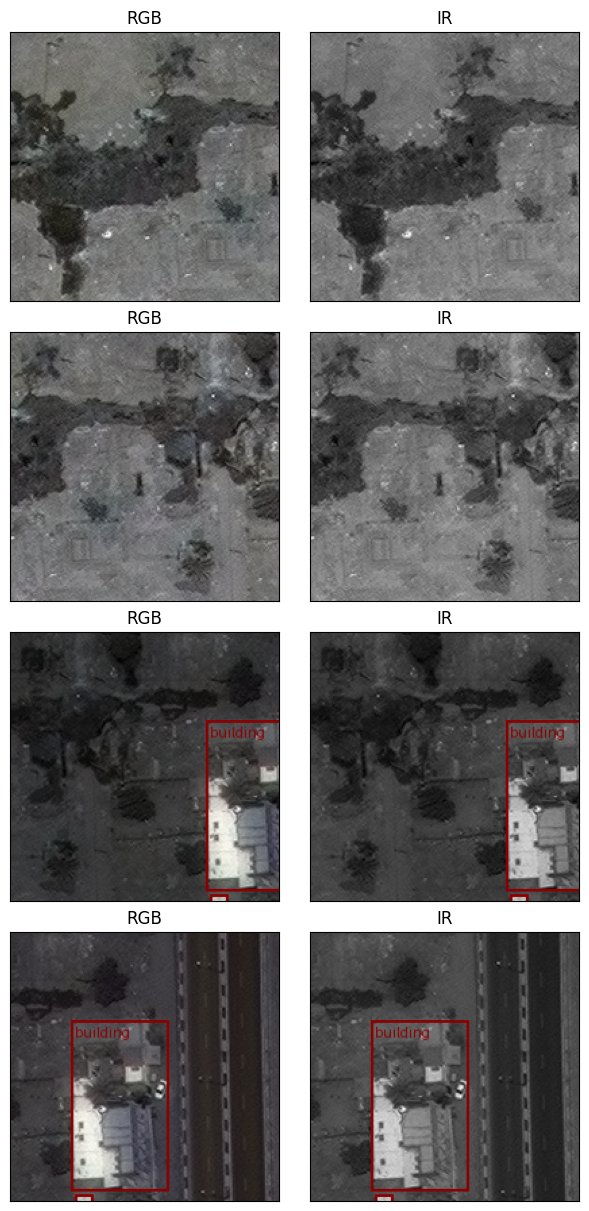
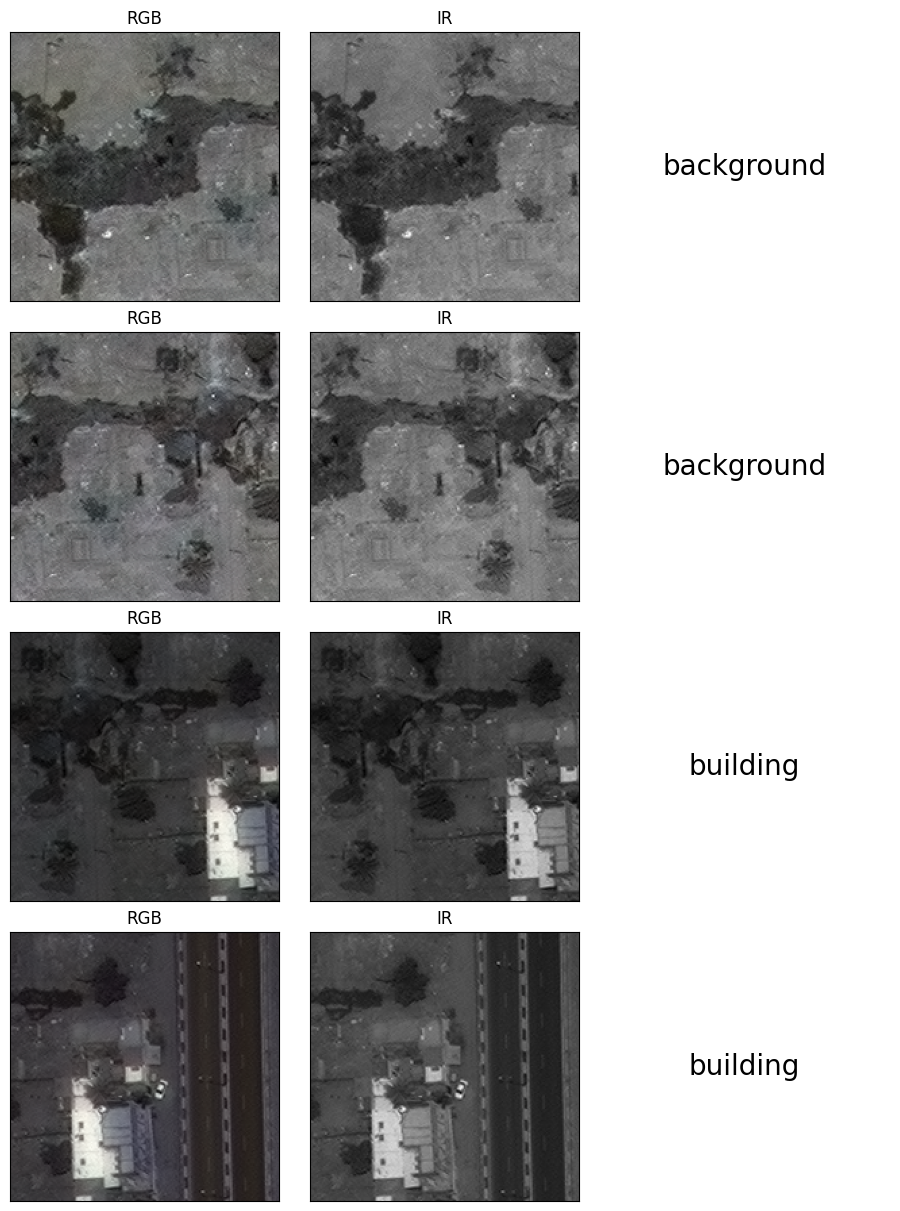
This notebook shows how to use Visualizer objects to plot image/label samples for computer vision PyTorch Datasets. There are examples for semantic segmentation, object detection, and image classification. We use Raster Vision’s GeoDataset functionality to read the data, but the Visualizer classes can be used with any images and labels as long as they are in the expected format.
Setup#
[2]:
from os.path import join

import matplotlib.pyplot as plt
import torch

from rastervision.pytorch_learner.dataset import (
    SemanticSegmentationSlidingWindowGeoDataset,
    ObjectDetectionSlidingWindowGeoDataset,
    ClassificationSlidingWindowGeoDataset)
from rastervision.pytorch_learner.dataset.visualizer import (
    SemanticSegmentationVisualizer,
    ObjectDetectionVisualizer,
    ClassificationVisualizer)
from rastervision.core.data import ClassConfig
[3]:
# These examples all use a scene from the SpaceNet 2 buildings dataset.
image_uri = 's3://spacenet-dataset/spacenet/SN2_buildings/train/AOI_5_Khartoum/PS-MS/SN2_buildings_train_AOI_5_Khartoum_PS-MS_img1004.tif'
label_uri = 's3://spacenet-dataset/spacenet/SN2_buildings/train/AOI_5_Khartoum/geojson_buildings/SN2_buildings_train_AOI_5_Khartoum_geojson_buildings_img1004.geojson'

class_config = ClassConfig(
    names=['background', 'building'],
    colors=['lightgray', 'darkred'],
    null_class='background')
chip_sz = 200
chip_stride = chip_sz // 2
# This describes how to group different input channels when plotting images.
# It's helpful when dealing with multiband imagery.
channel_display_groups = {'RGB': (0, 1, 2), 'IR': (3, )}
Semantic Segmentation – SemanticSegmentationVisualizer#
[4]:
ds = SemanticSegmentationSlidingWindowGeoDataset.from_uris(
    class_config=class_config,
    image_uri=image_uri,
    label_vector_uri=label_uri,
    label_vector_default_class_id=class_config.get_class_id('building'),
    image_raster_source_kw=dict(allow_streaming=True),
    size=chip_sz,
    stride=chip_stride)

vis = SemanticSegmentationVisualizer(
    class_names=class_config.names, class_colors=class_config.colors,
    channel_display_groups=channel_display_groups)
x, y = vis.get_batch(ds, 4)
vis.plot_batch(x, y, show=True)
2024-04-09 20:11:00:rastervision.pipeline.file_system.utils: INFO - Downloading s3://spacenet-dataset/spacenet/SN2_buildings/train/AOI_5_Khartoum/geojson_buildings/SN2_buildings_train_AOI_5_Khartoum_geojson_buildings_img1004.geojson to /opt/data/tmp/cache/s3/spacenet-dataset/spacenet/SN2_buildings/train/AOI_5_Khartoum/geojson_buildings/SN2_buildings_train_AOI_5_Khartoum_geojson_buildings_img1004.geojson...

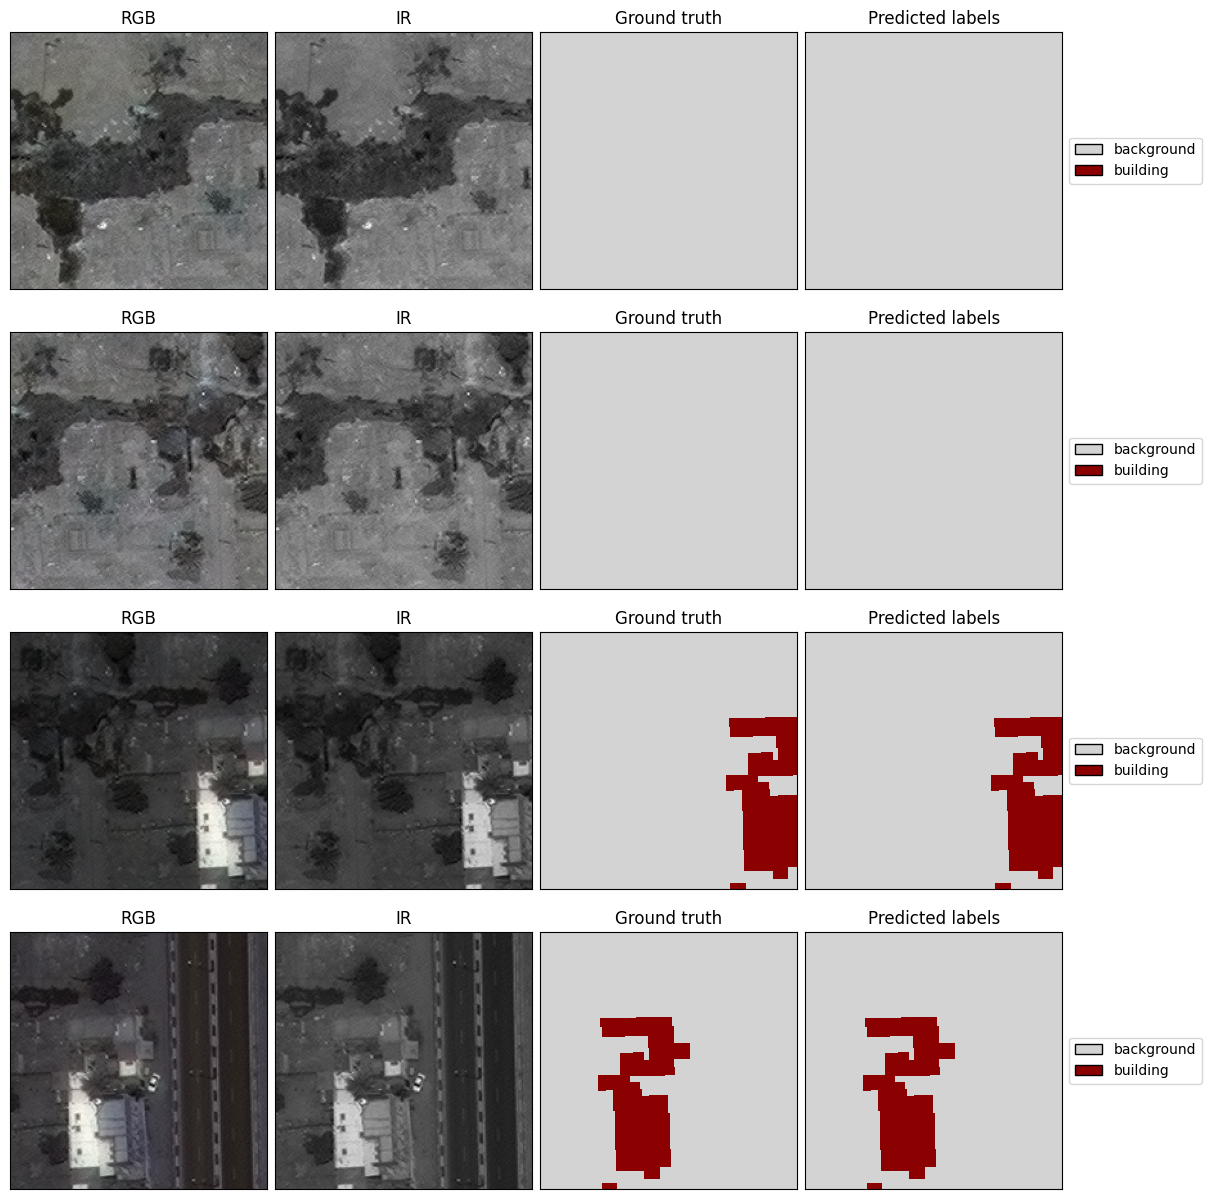
The Visualizer can also display predictions alongside ground truth labels. Here we will use the ground truth labels as mock predictions for testing purposes, simulating a model with perfect accuracy.
[5]:
z = torch.zeros((4, 3, 200, 200))
z[:, 1, :, :] = y
vis.plot_batch(x, y, z=z, show=True)

Object Detection – ObjectDetectionVisualizer#
[6]:
ds = ObjectDetectionSlidingWindowGeoDataset.from_uris(
    class_config=class_config,
    image_uri=image_uri,
    label_vector_uri=label_uri,
    size=chip_sz,
    stride=chip_stride,
    label_vector_default_class_id=class_config.get_class_id('building'),
    image_raster_source_kw=dict(allow_streaming=True))

vis = ObjectDetectionVisualizer(
    class_names=class_config.names, class_colors=class_config.colors,
    channel_display_groups=channel_display_groups)
x, y = vis.get_batch(ds, 4)
vis.plot_batch(x, y, show=True)
2024-04-09 20:11:17:rastervision.pipeline.file_system.utils: INFO - Using cached file /opt/data/tmp/cache/s3/spacenet-dataset/spacenet/SN2_buildings/train/AOI_5_Khartoum/geojson_buildings/SN2_buildings_train_AOI_5_Khartoum_geojson_buildings_img1004.geojson.

Image Classification – ClassificationVisualizer#
[7]:
ds = ClassificationSlidingWindowGeoDataset.from_uris(
    class_config=class_config,
    image_uri=image_uri,
    label_vector_uri=label_uri,
    label_vector_default_class_id=class_config.get_class_id('building'),
    size=chip_sz,
    stride=chip_stride,
    label_source_kw=dict(
        ioa_thresh=0.5,
        use_intersection_over_cell=False,
        pick_min_class_id=False,
        background_class_id=class_config.get_class_id('background'),
        infer_cells=True,
        cell_sz=chip_sz))
vis = ClassificationVisualizer(
    class_names=class_config.names, class_colors=class_config.colors,
    channel_display_groups=channel_display_groups)
x, y = vis.get_batch(ds, 4)
vis.plot_batch(x, y, show=True)
2024-04-09 20:11:21:rastervision.pipeline.file_system.utils: INFO - Downloading s3://spacenet-dataset/spacenet/SN2_buildings/train/AOI_5_Khartoum/PS-MS/SN2_buildings_train_AOI_5_Khartoum_PS-MS_img1004.tif to /opt/data/tmp/cache/s3/spacenet-dataset/spacenet/SN2_buildings/train/AOI_5_Khartoum/PS-MS/SN2_buildings_train_AOI_5_Khartoum_PS-MS_img1004.tif...
2024-04-09 20:11:22:rastervision.pipeline.file_system.utils: INFO - Using cached file /opt/data/tmp/cache/s3/spacenet-dataset/spacenet/SN2_buildings/train/AOI_5_Khartoum/geojson_buildings/SN2_buildings_train_AOI_5_Khartoum_geojson_buildings_img1004.geojson.
