Note
This page was generated from reading_vector_data.ipynb.
Note
If running outside of the Docker image, you may need to set some environment variables manually. You can do it like so:
import os
from subprocess import check_output

os.environ['GDAL_DATA'] = check_output('pip show rasterio | grep Location | awk \'{print $NF"/rasterio/gdal_data/"}\'', shell=True).decode().strip()
We will be accessing files on S3 in this notebook. Since those files are public, we set the AWS_NO_SIGN_REQUEST to tell rasterio to skip the sign-in.
[ ]:
%env AWS_NO_SIGN_REQUEST=YES
Reading vector data#
The VectorSource is Raster Vision’s abstraction for reading from a source of vector data.
Besides reading the data, they can also convert geometries from map-coordinates to pixel-coordinates and perform some data cleaning such as removing empty geometries and splitting apart multi-part geometries (e.g. MultiPolygon etc.).
One concrete implementation of it is the GeoJSONVectorSource which can read vector data from a GeoJSON file.
[1]:
from rastervision.core.data import GeoJSONVectorSource, RasterioCRSTransformer

img_uri = 's3://azavea-research-public-data/raster-vision/examples/spacenet/RGB-PanSharpen_AOI_2_Vegas_img205.tif'
label_uri = 's3://azavea-research-public-data/raster-vision/examples/spacenet/buildings_AOI_2_Vegas_img205.geojson'

crs_transformer = RasterioCRSTransformer.from_uri(img_uri)
vector_source = GeoJSONVectorSource(label_uri, crs_transformer)
Note
Note the use of RasterioCRSTransformer above. This allows us to match map coordinates in the label GeoJSON file to pixel coordinates in the image file.
We can read data from a VectorSource in three different formats:
as GeoJSON dict (
VectorSource.get_geojson())as Shapely geoms (
VectorSource.get_geoms())as a GeoPandas
GeoDataFrame(VectorSource.get_dataframe())
Each of these is shown in the following cells.
.get_geojson()#
[2]:
geojson = vector_source.get_geojson()
geojson['features'][:3]
2024-04-09 19:52:27:rastervision.pipeline.file_system.utils: INFO - Downloading s3://azavea-research-public-data/raster-vision/examples/spacenet/buildings_AOI_2_Vegas_img205.geojson to /opt/data/tmp/cache/s3/azavea-research-public-data/raster-vision/examples/spacenet/buildings_AOI_2_Vegas_img205.geojson...
[2]:
[{'type': 'Feature',
  'geometry': {'type': 'Polygon',
   'coordinates': (((552.0, 587.0),
     (485.0, 587.0),
     (485.0, 604.0),
     (482.0, 604.0),
     (482.0, 621.0),
     (503.0, 621.0),
     (503.0, 624.0),
     (515.0, 624.0),
     (515.0, 633.0),
     (552.0, 633.0),
     (552.0, 587.0)),)},
  'properties': {'OBJECTID': 0,
   'FID_VEGAS_': 0,
   'Id': 0,
   'FID_Vegas': 0,
   'Name': 'None',
   'AREA': 0.0,
   'Shape_Leng': 0.0,
   'Shape_Le_1': 0.0,
   'SISL': 0.0,
   'OBJECTID_1': 0,
   'Shape_Le_2': 0.0,
   'Shape_Le_3': 0.000625,
   'Shape_Area': 0.0,
   'partialBuilding': 0.0,
   'partialDec': 1.0}},
 {'type': 'Feature',
  'geometry': {'type': 'Polygon',
   'coordinates': (((561.0, 533.0),
     (562.0, 487.0),
     (486.0, 486.0),
     (485.0, 527.0),
     (541.0, 528.0),
     (541.0, 532.0),
     (561.0, 533.0)),)},
  'properties': {'OBJECTID': 0,
   'FID_VEGAS_': 0,
   'Id': 0,
   'FID_Vegas': 0,
   'Name': 'None',
   'AREA': 0.0,
   'Shape_Leng': 0.0,
   'Shape_Le_1': 0.0,
   'SISL': 0.0,
   'OBJECTID_1': 0,
   'Shape_Le_2': 0.0,
   'Shape_Le_3': 0.000658,
   'Shape_Area': 0.0,
   'partialBuilding': 0.0,
   'partialDec': 1.0}},
 {'type': 'Feature',
  'geometry': {'type': 'Polygon',
   'coordinates': (((553.0, 465.0),
     (552.0, 430.0),
     (485.0, 431.0),
     (486.0, 449.0),
     (482.0, 449.0),
     (480.0, 449.0),
     (480.0, 466.0),
     (482.0, 466.0),
     (509.0, 466.0),
     (509.0, 474.0),
     (553.0, 474.0),
     (553.0, 465.0)),)},
  'properties': {'OBJECTID': 0,
   'FID_VEGAS_': 0,
   'Id': 0,
   'FID_Vegas': 0,
   'Name': 'None',
   'AREA': 0.0,
   'Shape_Leng': 0.0,
   'Shape_Le_1': 0.0,
   'SISL': 0.0,
   'OBJECTID_1': 0,
   'Shape_Le_2': 0.0,
   'Shape_Le_3': 0.000627,
   'Shape_Area': 0.0,
   'partialBuilding': 0.0,
   'partialDec': 1.0}}]
.get_geoms()#
[3]:
def plot_geoms(geoms: list, title=''):
    from matplotlib import pyplot as plt
    from matplotlib import patches as patches
    import numpy as np

    fig, ax = plt.subplots(figsize=(5, 5))
    for g in geoms:
        if g.geom_type == 'Polygon':
            xy = np.array(g.exterior.coords)
            patch = patches.Polygon(xy, color='#55cc77', alpha=0.5)
            ax.add_patch(patch)
            patch = patches.Polygon(xy, edgecolor='#005511', fill=None, alpha=1)
            ax.add_patch(patch)
        elif g.geom_type == 'LineString':
            xy = np.array(g.buffer(1).exterior.coords)
            patch = patches.Polygon(xy, color='#005511', alpha=0.8)
            ax.add_patch(patch)
        else:
            raise NotImplementedError()
    ax.set_title(title, fontsize=14)
    ax.autoscale()
    plt.show()
[4]:
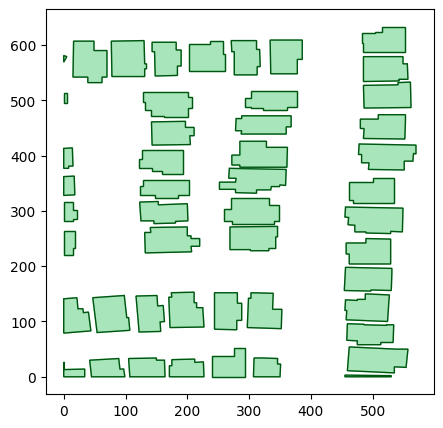
geoms = vector_source.get_geoms()
plot_geoms(geoms)

.get_dataframe()#
[5]:
df = vector_source.get_dataframe()
df.head()
[5]:
| geometry | OBJECTID | FID_VEGAS_ | Id | FID_Vegas | Name | AREA | Shape_Leng | Shape_Le_1 | SISL | OBJECTID_1 | Shape_Le_2 | Shape_Le_3 | Shape_Area | partialBuilding | partialDec | |
|---|---|---|---|---|---|---|---|---|---|---|---|---|---|---|---|---|
| 0 | POLYGON ((552.000 587.000, 485.000 587.000, 48... | 0 | 0 | 0 | 0 | None | 0.0 | 0.0 | 0.0 | 0.0 | 0 | 0.0 | 0.000625 | 0.0 | 0.0 | 1.0 |
| 1 | POLYGON ((561.000 533.000, 562.000 487.000, 48... | 0 | 0 | 0 | 0 | None | 0.0 | 0.0 | 0.0 | 0.0 | 0 | 0.0 | 0.000658 | 0.0 | 0.0 | 1.0 |
| 2 | POLYGON ((553.000 465.000, 552.000 430.000, 48... | 0 | 0 | 0 | 0 | None | 0.0 | 0.0 | 0.0 | 0.0 | 0 | 0.0 | 0.000627 | 0.0 | 0.0 | 1.0 |
| 3 | POLYGON ((551.000 374.000, 493.000 375.000, 49... | 0 | 0 | 0 | 0 | None | 0.0 | 0.0 | 0.0 | 0.0 | 0 | 0.0 | 0.000744 | 0.0 | 0.0 | 1.0 |
| 4 | POLYGON ((535.000 315.000, 468.000 315.000, 46... | 0 | 0 | 0 | 0 | None | 0.0 | 0.0 | 0.0 | 0.0 | 0 | 0.0 | 0.000634 | 0.0 | 0.0 | 1.0 |
Transforming vector data using VectorTransformers#
Just like we can transform rasters by specifying a series of RasterTransformers, we can specify VectorTransformers to transform vector data.
Inferring class IDs for polygons#
One very important VectorTransformer is the ClassInferenceTransformer.
When using vector data in machine learning, it is important that each polygon be labeled with an appropriate class ID. But often, your data will not have this property stored in the GeoJSON file.
The ClassInferenceTransformer can automatically infer and attach a class_id to each polygon read from the VectorSource. It can
Assign the same
class_idto all the polygons (a very common use case).Map class names to
class_ids given a mapping.Use a MapBox-style filter (see https://docs.mapbox.com/mapbox-gl-js/style-spec/other/#other-filter).
The example below shows how to use the first of the above methods.
[7]:
from rastervision.core.data import (
    GeoJSONVectorSource, RasterioCRSTransformer,
    RasterizedSource, ClassInferenceTransformer)

img_uri = 's3://azavea-research-public-data/raster-vision/examples/spacenet/RGB-PanSharpen_AOI_2_Vegas_img205.tif'
label_uri = 's3://azavea-research-public-data/raster-vision/examples/spacenet/buildings_AOI_2_Vegas_img205.geojson'

crs_transformer = RasterioCRSTransformer.from_uri(img_uri)
vector_source = GeoJSONVectorSource(
    label_uri,
    crs_transformer,
    vector_transformers=[ClassInferenceTransformer(default_class_id=1)])
[8]:
df = vector_source.get_dataframe()
df[['geometry', 'class_id']].head()
2024-04-09 19:53:12:rastervision.pipeline.file_system.utils: INFO - Using cached file /opt/data/tmp/cache/s3/azavea-research-public-data/raster-vision/examples/spacenet/buildings_AOI_2_Vegas_img205.geojson.
[8]:
| geometry | class_id | |
|---|---|---|
| 0 | POLYGON ((552.000 587.000, 485.000 587.000, 48... | 1 |
| 1 | POLYGON ((561.000 533.000, 562.000 487.000, 48... | 1 |
| 2 | POLYGON ((553.000 465.000, 552.000 430.000, 48... | 1 |
| 3 | POLYGON ((551.000 374.000, 493.000 375.000, 49... | 1 |
| 4 | POLYGON ((535.000 315.000, 468.000 315.000, 46... | 1 |
Buffering Point and LineString geometries into polygons#
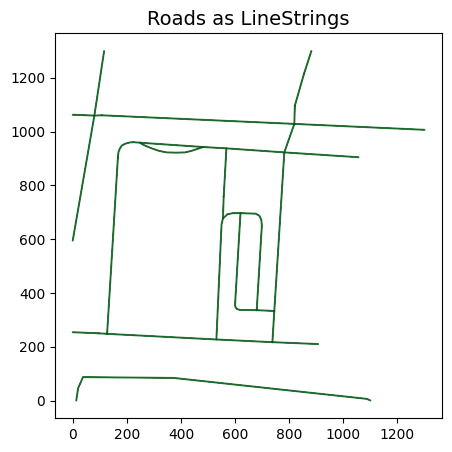
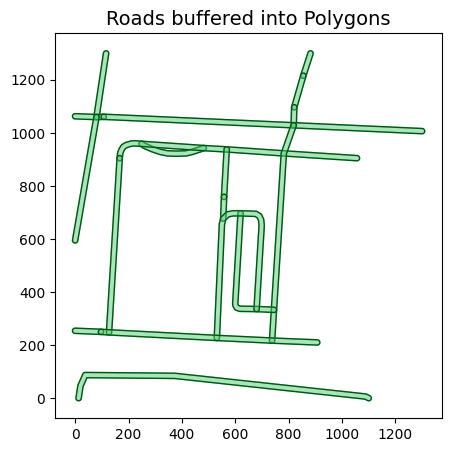
Point and LineString geometries are not directly useable if doing, say, semantic segmentation. The cells below show an example of converting road geometries (given in the form of ``LineString``s) into polygons using the BufferTransformer.
Data source: https://spacenet.ai/spacenet-roads-dataset/
[9]:
from rastervision.core.data import (
    GeoJSONVectorSource, RasterioCRSTransformer,
    RasterizedSource, BufferTransformer)

img_uri = 's3://spacenet-dataset/spacenet/SN3_roads/train/AOI_4_Shanghai/PS-RGB/SN3_roads_train_AOI_4_Shanghai_PS-RGB_img999.tif'
label_uri = 's3://spacenet-dataset/spacenet/SN3_roads/train/AOI_4_Shanghai/geojson_roads/SN3_roads_train_AOI_4_Shanghai_geojson_roads_img999.geojson'

crs_transformer = RasterioCRSTransformer.from_uri(img_uri)
[10]:
def plot_geoms(geoms: list, title=''):
    from matplotlib import pyplot as plt
    from matplotlib import patches as patches
    import numpy as np

    fig, ax = plt.subplots(figsize=(5, 5))
    for g in geoms:
        if g.geom_type == 'Polygon':
            xy = np.array(g.exterior.coords)
            patch = patches.Polygon(xy, color='#55cc77', alpha=0.5)
            ax.add_patch(patch)
            patch = patches.Polygon(xy, edgecolor='#005511', fill=None, alpha=1)
            ax.add_patch(patch)
        elif g.geom_type == 'LineString':
            xy = np.array(g.buffer(1).exterior.coords)
            patch = patches.Polygon(xy, color='#005511', alpha=0.8)
            ax.add_patch(patch)
        else:
            raise NotImplementedError()
    ax.set_title(title, fontsize=14)
    ax.autoscale()
    plt.show()
[12]:
vector_source = GeoJSONVectorSource(label_uri, crs_transformer)
plot_geoms(vector_source.get_geoms(), title='Roads as LineStrings')
2024-04-09 19:53:33:rastervision.pipeline.file_system.utils: INFO - Downloading s3://spacenet-dataset/spacenet/SN3_roads/train/AOI_4_Shanghai/geojson_roads/SN3_roads_train_AOI_4_Shanghai_geojson_roads_img999.geojson to /opt/data/tmp/cache/s3/spacenet-dataset/spacenet/SN3_roads/train/AOI_4_Shanghai/geojson_roads/SN3_roads_train_AOI_4_Shanghai_geojson_roads_img999.geojson...

[13]:
vector_source_buffered = GeoJSONVectorSource(
    label_uri,
    crs_transformer,
    vector_transformers=[BufferTransformer(geom_type='LineString', default_buf=10)])

plot_geoms(vector_source_buffered.get_geoms(), title='Roads buffered into Polygons')
2024-04-09 19:53:40:rastervision.pipeline.file_system.utils: INFO - Using cached file /opt/data/tmp/cache/s3/spacenet-dataset/spacenet/SN3_roads/train/AOI_4_Shanghai/geojson_roads/SN3_roads_train_AOI_4_Shanghai_geojson_roads_img999.geojson.

Rasterizing vector data using RasterizedSource#
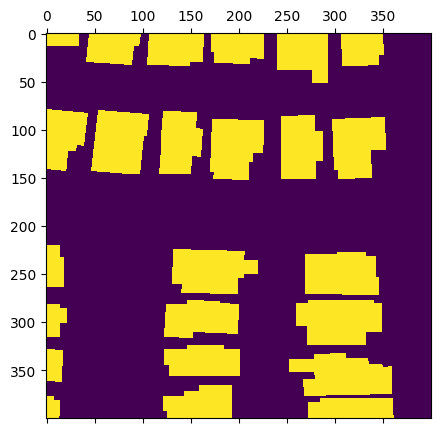
Suppose we have semantic segmentation labels in the form of polygons. To use them for training, we will first need to convert them into rasters. Raster Vision allows accomplishing this using the RasterizedSource class.
The RasterizedSource is a RasterSource that reads data from a VectorSource (rather than an image file) and then converts it into rasters. It can be indexed like any other RasterSource.
[15]:
from rastervision.core.data import (
    GeoJSONVectorSource, RasterioCRSTransformer,
    RasterizedSource, ClassInferenceTransformer)

img_uri = 's3://azavea-research-public-data/raster-vision/examples/spacenet/RGB-PanSharpen_AOI_2_Vegas_img205.tif'
label_uri = 's3://azavea-research-public-data/raster-vision/examples/spacenet/buildings_AOI_2_Vegas_img205.geojson'

crs_transformer = RasterioCRSTransformer.from_uri(img_uri)
vector_source = GeoJSONVectorSource(
    label_uri,
    crs_transformer,
    vector_transformers=[ClassInferenceTransformer(default_class_id=1)])

rasterized_source = RasterizedSource(
    vector_source,
    background_class_id=0,
    # Normally we'd pass in the RasterSource's extent, but we don't have that here.
    bbox=vector_source.extent)
2024-04-09 19:54:07:rastervision.pipeline.file_system.utils: INFO - Using cached file /opt/data/tmp/cache/s3/azavea-research-public-data/raster-vision/examples/spacenet/buildings_AOI_2_Vegas_img205.geojson.
[16]:
chip = rasterized_source[:400, :400]
chip.shape
[16]:
(400, 400, 1)
[17]:
from matplotlib import pyplot as plt

fig, ax = plt.subplots(figsize=(5, 5))
ax.matshow(chip)
plt.show()
